Mastering the Data Visualization Design Process


Imagine being able to make any type of chart easier to understand when you're trying to get important points across in your business. It's important to make an impact. The best way to go about it is to help people understand the data you are presenting. Creating an effective data representation makes sharing any volume of data more accessible.
But if you make it difficult to read graphics, you'll lose your audience. But in order to build a successful business, you need to create graphics for the human brain to comprehend quickly.
Are you looking for a way to convert complex information clearly and effectively? We are writing this blog to help you make better decisions about the data you're sharing. We'll make sure you're equipped with the tools needed to communicate a data set with your audience. At the end of this blog, you will understand the different types of charts used to compare a lot of data without being overwhelmed.
Key Takeaways
- Data analysis and graphical representation design is an art
- Follow best practices to create visually appealing and informative graphics
- You must identify your objects with data in order to create stunning representations
- Set SMART goals
It's important to make sure you understand your audience's data literacy levels. You need to understand audience needs, select appropriate types of visuals, and improve clarity. Effective data representations combine different data sets with aesthetics and white space. Employing typography helps viewers understand and interpret data, too. We will cover all these aspects here so you can follow design principles for success.
Understanding the Importance of Design: Essential Steps for Impactful Charts and Graphs

You need to follow a data visualization process for any type of data you need to share. The process aids in making the data you have easy for your audience to understand.
The process of creating visuals includes the following:
- Creating a visual on paper first
- Setting objectives
- Helping your audience to see data by understanding the needs
- Selecting an appropriate chart to use
- Clarification through aesthetics
- Utilizing color and typography to create compelling data visuals
- Providing context
- Adding interactive elements
- Refinement with feedback
Data visualization is a coherent strategy for sharing complex information. Similarly, it's an art that requires attention to detail and a keen understanding of best practices.
Don't Underestimate Identifying Your Objective
Ever wonder what makes a data graphic downright awesome? Like hitting the bullseye in a game of darts – it all comes down to having a crystal-clear target and knowing what your audience likes.
You've got data. But what's the story? This is where precise objectives come into play. Your objectives should guide every choice you make. Whether it's showing off your company's skyrocketing sales or mapping out trends, your goal isn't just a dot on the plot. You are trying to answer questions customers or investors may have with it.
Understanding them is like being a mind reader. Are they number-crunching pros or just casual observers? You can't just throw facts and figures their way; you need to create a visual that speaks directly to them in their language.
Use Goal Setting to Improve Your Designs
Let's talk about goals. The kind that turns your data representations from 'meh' to 'wow'!
Too much color here, a confusing chart there, and suddenly, your audience is lost and confused. The trick is to dodge common but sneaky pitfalls. Avoid the dazzle of misleading colors, the clutter of overloaded charts, and the seduction of style over substance.
Remember, your visual can be pretty, but it must tell a story.
So how can you do that? Use SMART goals.
Specific, Measurable, Achievable, Relevant, and Time-bound. These aren't buzzwords. They're your secret to visuals people want to understand. Using SMART goals allows you to craft a story that people understand. That's how you ensure your graphics look snazzy and pack a punch.
In the world of data visuals, it's all about knowing who's on the other side of the screen. A younger crowd might enjoy visuals that are interactive, colorful, and dynamic. But a more seasoned audience might appreciate something more like a classic painting – simple, straightforward, and easy on the eyes.
A person's education level and professional background can affect the complexity and depth of the visualizations you can use. More educated and experienced audiences will find complex data plots easy to comprehend. It's because as the human brain develops, it adapts to different levels of information.
The easiest way to nail your data representations is with market research. The more you know about them, the more you can create graphics they will like.
Selecting the Right Chart Type For Your Dataset
When creating visualizations, selecting the right kind can make or break their success.
Are you comparing, contrasting, or unveiling a pattern of trends over a period of time? Knowing the data type and who will read it will determine which is best for your goal.
As mentioned above, you should start by outlining your objective and an understanding of your audience.
After that, you can easily choose the chart that best suits your needs.
Comparing Data Points: Using the Right Graph
Bar charts, line graphs, and other chart types are useful for comparing data points and highlighting trends or differences.
A bar chart provides a visual representation of values from different categories or variables. The length or height of bars correlates to values in the chart, making them easy to read and understand,
Line charts, on the other hand, excel at illustrating patterns and trends of multiple data sets over a specified period, allowing for easier identification of similarities, differences, and fluctuations.
Imagine you're running a lemonade stand. You've got your sales data from the sunny days of June through the breezy afternoons of September. How do you figure out when your lemonade was a hit? Should you use a bar or line chart? For this, you should choose the latter. Plot each day's sales on it, and voilà – you’ve got a visual story of your lemonade business.
When you see peaks, you know those were the scorching hot days when everyone craved your refreshing drinks. And the dips? Maybe they were those rainy days when lemonade was the last thing on people’s minds.
Line plots turn your sales data into visual stories, showing you at a glance when your business was booming and when it would have benefitted from a few sales. Comprehending the strengths and weaknesses of each chart type enables you to choose the most suitable chart to illustrate your specific data points effectively.
Showing Relationships: Visualization Techniques and Data Labels
Scatter plots and heat maps are dynamic duos when you need to understand relationships in data. These show how different data points relate to each other. Picture a bunch of dots on a plot, each one representing an event in the story you need to convey. These dots form patterns – it may be a straight line (linear relationship) or a freestyle pattern (non-linear relationship).
Heat maps are like thermal cameras for your data, showing you the hot spots and cool zones. They take complex data sets with multiple variables and turn them into a colorful visual. The warmer the color, the higher the value; the cooler the lower the value. It’s a quick, intuitive way to spot trends and patterns that you might miss in a sea of numbers.
Suppose you're using a fitness tracker to monitor your daily steps and sleep hours. How do you find out if there's a connection between how much you walk and how well you sleep?
Use a scatter plot. Plot your daily steps against your sleep hours. Do you see a pattern emerging? Maybe on days with more steps, you have longer sleep hours, showing a positive correlation between exercise and sleep.
What if you want to see how your activity and sleep patterns change over the year? This is where a heat map shines. Plot the months on one axis and hours of sleep on the other. Then, use colors to represent the number of steps. Suddenly, you've got a year's worth of data telling you a story about your health habits.
What's The Best Way To Represent Parts of a Whole To Your Target Audience?
Pie charts and other part-to-whole visualizations help illustrate proportions and emphasize the significance of individual components. By using quantitative data, these charts assign variables to portions of the circle for easy comparison.
While they are a popular choice for representing parts of a whole, there are other options like:
- Bar charts
- Line charts
- Scatterplots
- Flowcharts
All these are effective at showing data in a similar way. Here's an example to help you understand better.
At a community bake sale aimed to raise funds for a local park, a variety of baked goods were sold. A pie chart was created to understand sales trends, showing each item (cakes, pies, cookies, and muffins) as a slice proportional to its sales.
The chart revealed pies as the top seller, prompting the community to focus on them for future events. This visual tool effectively communicated the sale's success and guided future planning, demonstrating the power of pie charts in transforming raw data into actionable insights.
Enhancing Clarity and Aesthetics in Data Graphics
Enhancing data visualization clarity and aesthetics involves strategically using white space, establishing a visual hierarchy of data, removing unnecessary elements, and addressing missing values.
In the following sections, we’ll explore these concepts in more detail to help you level up your data representations.
Leveraging White Space and Typeface Selection
In the world of data representations, blank space is your best friend. You can use it to create an impact. Think of it as your visualization’s personal guide. It takes your viewer by the hand and leads them through the data with ease. Wondering how? Let's break it down.
Blank space can:
- Improve readability and legibility
- Create balance and harmony
- Enhance the user experience
- Focus attention on key elements
Proper use of blank space can increase comprehension by up to 20%. Incorporating white space strategically in your design results in a cleaner, easier-to-follow presentation.
Creating Flow with a Visual Hierarchy Using Color and Lettering
Visual hierarchy is all about using the right design elements – size, color, and design – to make your data easy to understand.
You can employ visual hierarchy by:
- Using visual cues
- Keeping visuals simple
- Telling a story with data
- Using datum correctly
Color plays an important role in establishing visual hierarchy by:
- Highlighting data and trends
- Guiding the viewer through the data
- Storytelling and creating feelings
- Improving comprehension
Establishing a clear visual hierarchy guides your audience through your visualization. It directs their focus toward relevant information.
Eliminate Junk To Make Visuals Easy to Follow
Each piece of data you share is important. The last thing you want is clutter that distracts viewers. Eliminate unimportant data to create clear and concise data graphics.
Consider if you really need any of the following in a data visual:
- Background images that don't add information
- Background colors
- 3D effects
- Bold labels
- Repetitive labels
- Borders
- All given data
Excessive Borders and Lines are overbearing. They draw the eye away from the data and create confusion. When your visualization is overloaded with these elements, it's like a noisy room where everyone is talking at once. It's hard to focus, understand, or remember.
You're presenting data to get work done. You don't want your viewers playing "Where's Waldo?" So, only present the most important data to them.
Utilizing Color and Typography Effectively for Engaging Data Visualizations
Colors are communicators. Picking the right ones is like carefully choosing words for a speech. Each color sets a tone and evokes emotions.
Choosing Colors Wisely: Best Practices to Visualize Data Effectively
When you select colors with care and purpose, your data visualization transforms into a canvas that speaks to everyone. Choosing colors wisely involves considering color associations, contrast, and accessibility.
Selecting colors for your data visualization is an art form in itself. It's a thoughtful process that enhances the narrative, guides the viewer, and embraces inclusivity.
Applying Legible and Consistent Typography in Good Data Visualization
Legible and consistent typography is important to consider when creating data graphics. With the right fonts and sizes, you can guide users through your data story. Sizes and headers work like signal words in English. They can tell signals where people should look first, next last, and so on.
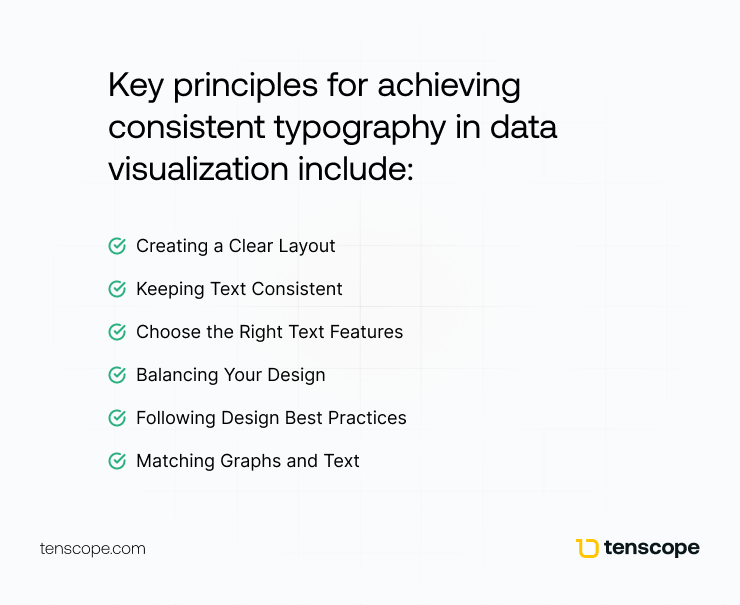
Key principles for achieving consistent typography in data visualization include:
- Creating a Clear Layout: Organize your text so it's easy to see what's most important. It's like putting the biggest, boldest sign on the main road and smaller signs on the side streets.
- Keeping Text Consistent: Use the same font size and style throughout your presentations. It makes everything look coordinated and neat.
- Choose the Right Text Features: Pick fonts, sizes, colors, and placements that make your text easy to read and fit your design well.
- Balancing Your Design: Make sure your text and graphics complement each other without one overpowering the other.
- Following Design Best Practices: Stick to established design rules to make your data graphics user-friendly.
- Matching Graphs and Text: Ensure your graphs and text look like they belong together.
Using these guidelines, you can create charts and graphs people understand well.
Incorporating Interactivity and Context
People become bored if anything involves sitting and listening. To combat this, you can use interactive elements. You can give them hover and click buttons to keep them analyzing the data you're sharing. Or you can Include explanations, annotations, or stories to help users understand what they're seeing. We are going to explain the reasons to consider interactive data in your data graphics.
Interactive Data Exploration: Use Data to Engage and Inform

Interactive visualizations enable users to:
- Find hidden patterns within your data story
- Manipulate data to learn more
- Discover new connections they may otherwise miss
You can employ many interactive tools to help you make data more interesting. Some common platforms businesses use are:
- Google Charts
- Tableau
- Grafana
- Chartist.js
- FusionCharts
- Datawrapper
- Infogram
- ChartBlocks
- D3.js
If you want people to understand and analyze your data, you need to incorporate charts. If not, people will pretend to focus, but rest assured they'll only retain about half of what they're taking in.
Why Context Matters in Data Visualization
Have you ever read a book with so many potholes the story is hard to understand? If so, you probably put the book down not long after starting it. You need context clues to help you make predictions and visualize a story.
Context clues aren't important only when reading. They help us decipher the world around us daily. Providing context clues in your data visuals helps viewers understand what they're seeing. If they can't understand something, context clues will allow them to put pieces together.
You can add context clues that guide people through your data or provide more information. Both are great choices, but one thing is clear: neglecting to add context clues will result in not getting your point across.
Refining Your Visualization with Feedback

Sometimes, you will miss the mark when you first create a data visual. With feedback and iteration, you can guarantee your intended message is well received by your audience.
Here's how feedback helps you:
- Spotting What Needs Work: Feedback like having a friend point out where your visualization could be better or clearer.
- Making it Better for Users: You will understand how people use and feel about your visualization so you can make them better.
- Checking if Your Design Works: Asking people about your data graphics is a reality check for your design choices.
- Keeping Your Design Fresh: Regular feedback helps continuously improve.
Don't neglect to incorporate feedback into your data graphics. You don't do it for your business, so why would you if you want to communicate information to people about your business? So, next time you start making infographics, stop at one. Share it with someone and ask what they think.
Summary
Becoming great at data visualization means learning how to turn complex data into stunning, clear, and informative visuals.
Here's what we've covered in this blog post.
- Set Clear Goals: Know what you want your visualization to achieve. It's like having a destination in mind before starting a journey.
- Know Your Audience: Understand who will be looking at your data and what they need from it. It's like picking the right story for the right audience.
- Choose the Right Type of Visualization: Pick the best way to show your data, whether it’s a bar chart, a line graph, or something else. It’s like choosing the right tool for a job.
- Make it Clear and Good-Looking: Focus on making your visualization easy to understand and visually appealing. It's like making sure your story is both easy to read and attractive.
- Use Color and Typography Wisely: Choose colors and fonts that make your visualization pop and easy to read. It's like dressing up your data in its best outfit.
- Add Interactive Elements: Let your audience explore the data themselves. It's like giving them a hands-on experience with your story.
- Provide Context: Help your audience understand your data by adding notes or explanations. It's like giving them a map to navigate the story.
- Get and Use Feedback: Listen to what others say about your visualization and use their insights to make it better. It’s like refining your story based on what your readers tell you.
By mastering these steps, you can turn even the most complex data into engaging visual stories that grab your audience's attention and help them make informed decisions.
Now, it's your turn to take your data and tell its story in a way that truly resonates with your audience!
Frequently Asked Questions About Learning the Basics of Data Visualization Design
What are the steps in designing data graphics?
The process consists of steps such as understanding the audience, choosing the right chart, selecting a software program, decluttering, clarifying the message with colors and text, testing your draft, and sharing the completed graphic.
How can I improve the clarity and aesthetics of my data visualization?
To improve the clarity and aesthetics of my data visualization, you should use blank space strategically, establish a visual hierarchy, and eliminate unnecessary elements.
What factors should I consider when selecting colors for my data visualization?
When selecting colors for data visualization, consider color associations, contrast, and accessibility.
How can interactive visualizations improve user comprehension of data?
Interactive elements give people the freedom to manipulate data and learn more about it.